Neighborhood Vulnerability and Displacement Risks in Texas Metropolitan Regions
The analysis presented in these maps examines patterns of vulnerability and neighborhood change in the 25 metropolitan regions (MSAs) in Texas. Metropolitan regions are a crucial nexus of economic activity and population growth in the state. The ways these regions are growing and changing strongly shape socioeconomic, environmental and health outcomes of Texas residents now and into the future.
This work examines patterns of neighborhood change in Texas metros over the 2000-2018 period.[i] The maps portray important socio-demographic characteristics and patterns of change at the census tract level within Texas MSAs. The key measures and methods for this analysis drew from the literature on neighborhood vulnerability and neighborhood change, especially Uprooted: Residential Displacement in Austin’s Gentrifying Neighborhoods and What Can Be Done About It (Way, Mueller, and Wegmann, 2018)[ii].
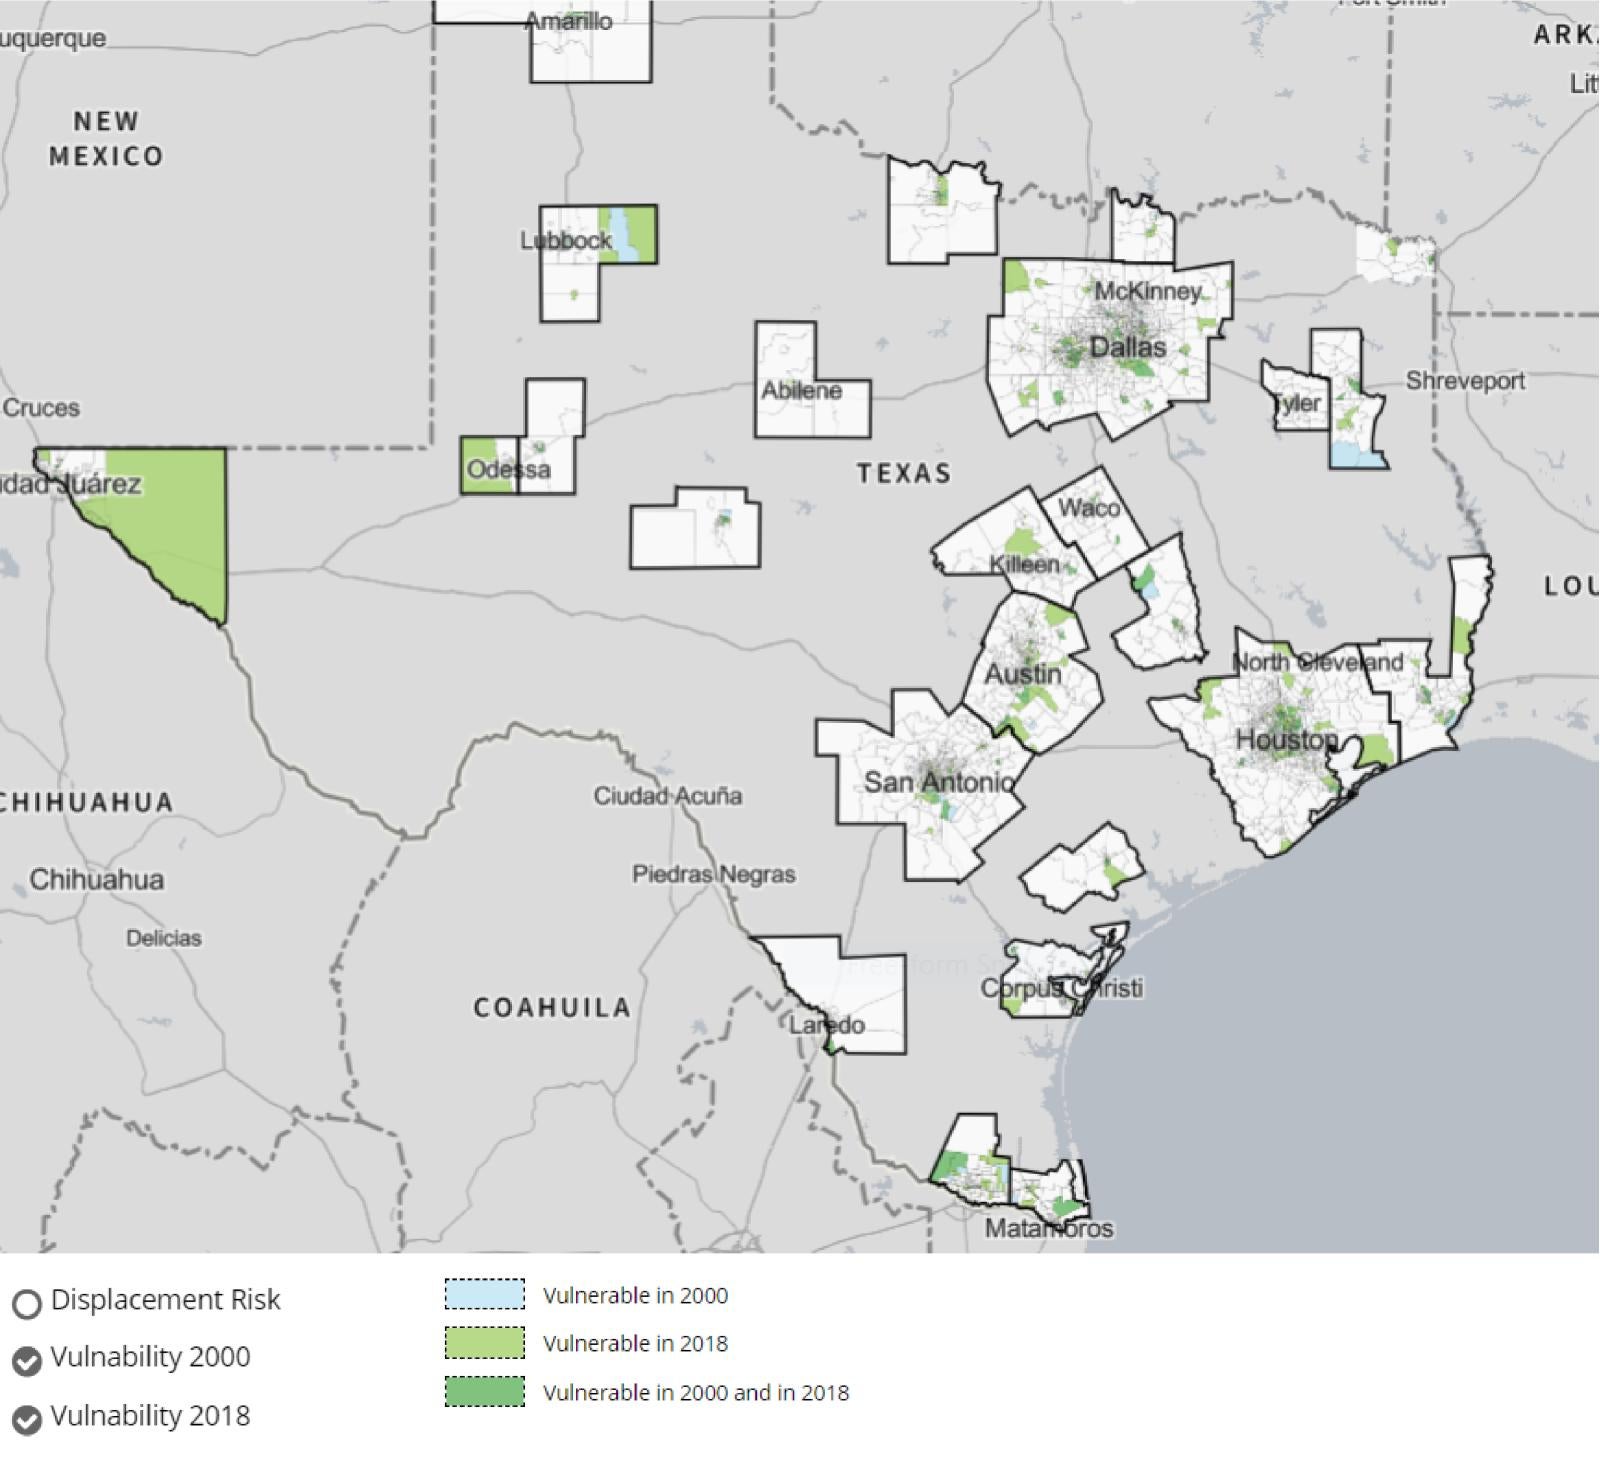
The first key measure developed is a vulnerability index for each census tract in the Texas MSAs. The vulnerability index registers demographic and socioeconomic factors in a neighborhood (census tract) that may make it more vulnerable to a range of factors including displacement due to rising housing costs, environmental shocks (such as flooding) and public health challenges (such as COVID-19). The vulnerability index was constructed from a short list of indicators that researchers have identified as making communities more susceptible to housing cost increases and other changes or shocks. As Way et al. state, “Social vulnerability refers to the differing ability of members of particular socio-demographic groups to withstand threats to their livelihoods, security, and social, economic and political networks.” (Way, Mueller and Wegmann, 2018, p. 19).
For more detail, explore the map here.
The vulnerability index for each census tract is constructed from five variables:
- Race and ethnicity - defined as the percent of residents who identify as anything other than non-Hispanic/Latino, White alone;
- Lower levels of educational attainment - defined as the percent of residents 25 or over who do not have a bachelors degree or higher;
- Low income - defined as median family income in a census tract as a percent of median family income in the MSA. If a census tract’s median family income is 80 percent or less of the MSA median, the tract is defined as low income;
- Renters - defined as the percent of households who rent rather than own their homes;
- Children in poverty - defined as the share of young people who live in households with income below the poverty line.
Census tracts within the 25 MSAs were considered vulnerable if at least three of the five variables above had significantly higher values than the average in the given MSA. With the exception of “low income,” the significance of the tract difference was estimated with a Z-score. If the Z-score for at least three of the above variables exceeded +0.5 the tract and/or was classified as low income, it was designated as vulnerable.
In the maps of each MSA, vulnerable census tracts in 2000 are shown in dark blue. Vulnerable tracts in 2018 are designated in light green. Tracts that had high vulnerability scores for both 2000 and 2018 are shown in dark green.
When looking overtime at overall metro population change in Texas MSAs, there has been a significant suburbanization trend as the urban share of the total metro population fell from 66 percent in 1990 to 59 percent by 2015. The suburban population share increased by 7.2 percent over the period, equaling 41 percent of the total metro population by 2015. However, in select Texas metro areas, the share of population growth in core urban areas of MSAs exceeded suburban growth over the 2010-2015 period.[iii] This recent change in urban-suburban growth patterns is consistent with a national resurgence in core urban areas and a shifting preference for city life discussed in numerous popular and scholarly reports.[iv] Some have called this shifting pattern of metro growth an “urban inversion” where higher-income residents are moving back to more central urban areas after a half-century of flight to suburban communities.[v]
For more detail, explore the map here.
It is not clear if the revival and rapid population growth in core urban areas is a growing trend in most Texas metros. However, robust growth in some urban areas may increase the risk that residents of vulnerable neighborhoods will be displaced by the influx of new residents and increasing housing costs.
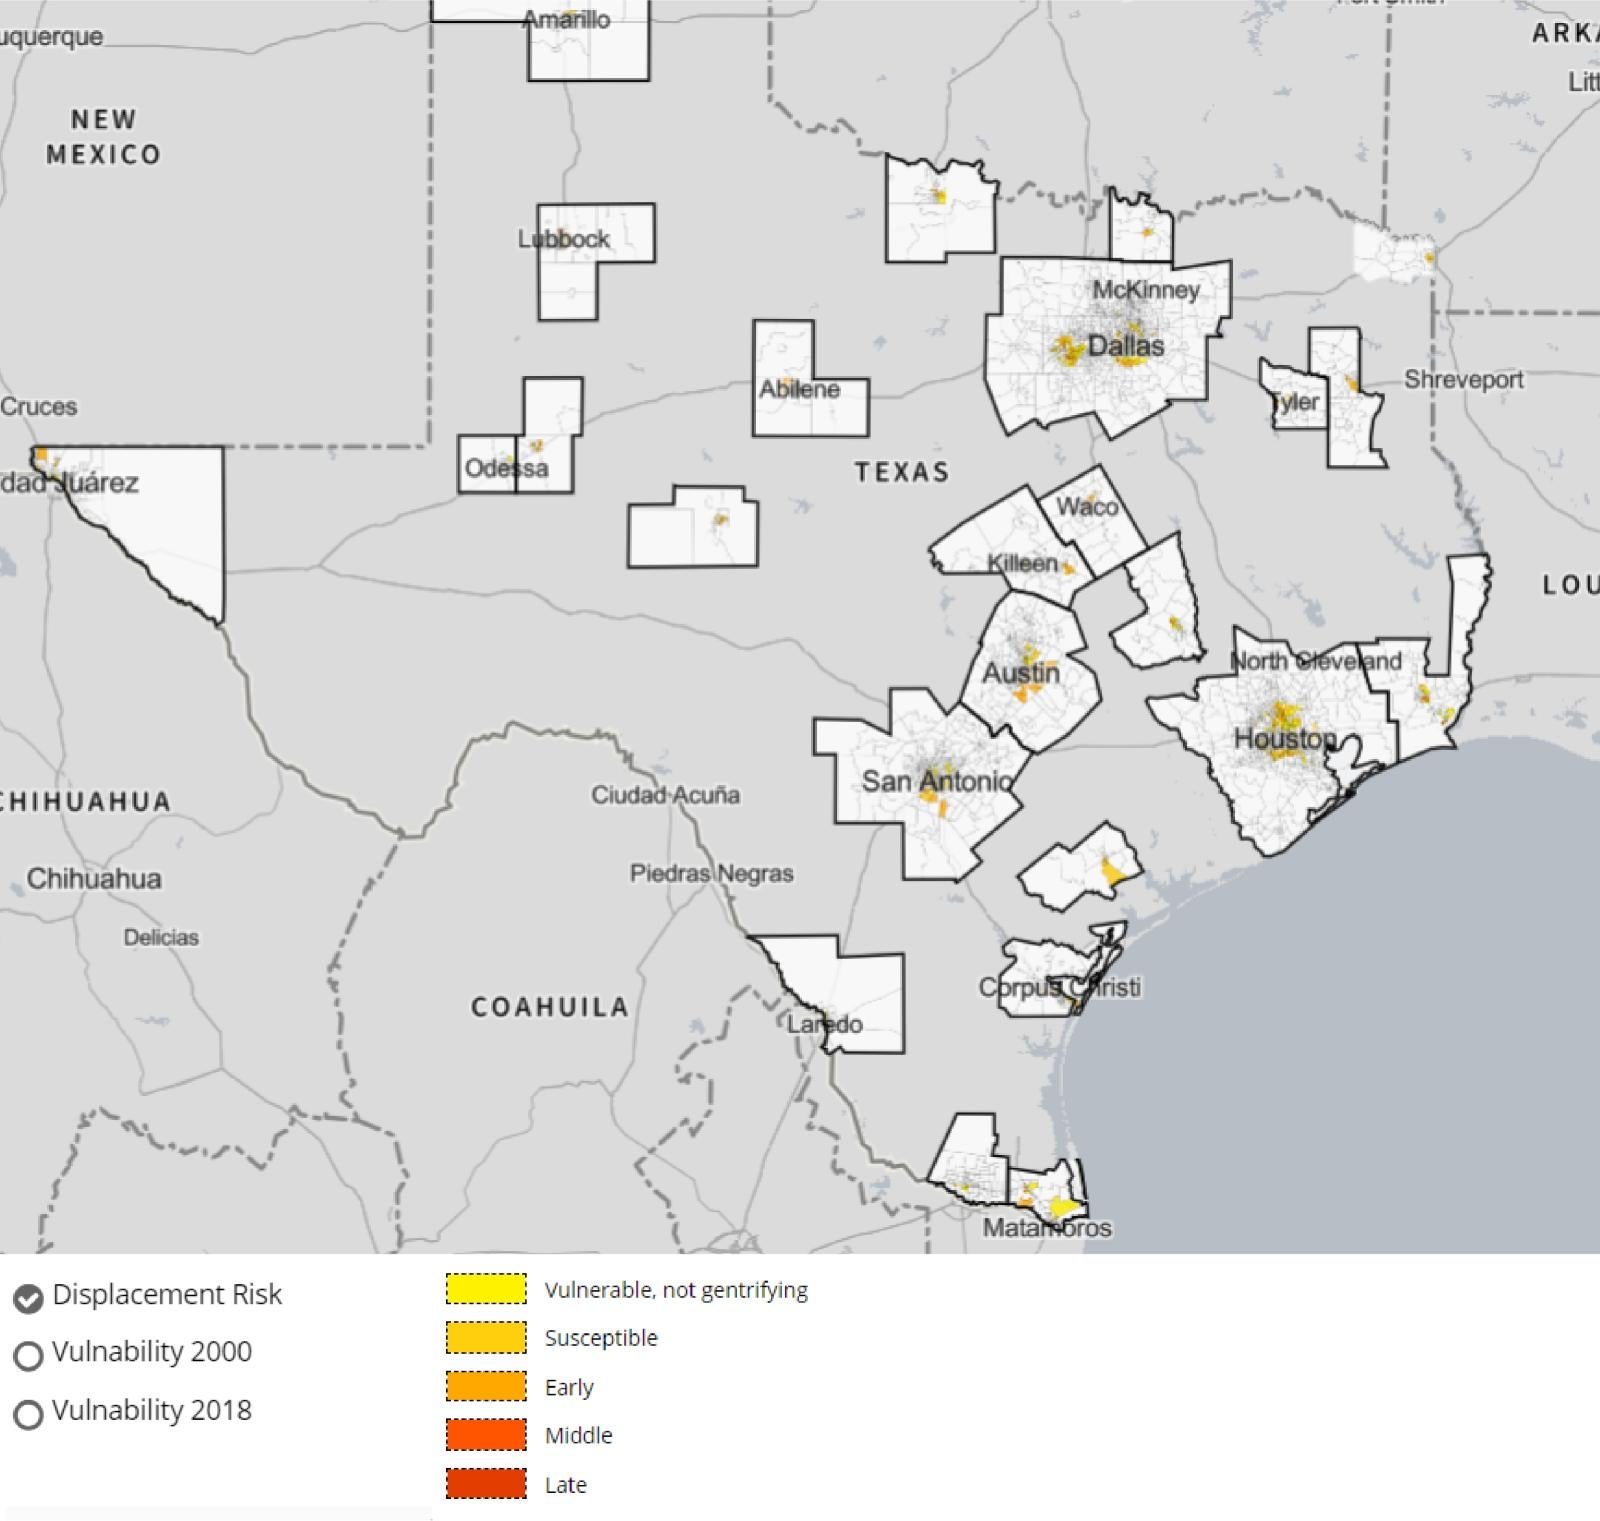
We attempt to measure the risk that residents in urban census tracts might face displacement (or gentrification pressures) in urban areas across the 25 Texas metros. To conduct this analysis we analyzed patterns of demographic and housing cost change over the 2000-2018 period.
Table 1: Displacement Risk or Gentrification Pressures
Neighborhood Type |
Vulnerable Tracts 2000, 2018Census (14-18 ACS) |
Demographic Change between 2000 Census and 2018 Census (14-18 ACS) |
Housing Market Change, 2000 Census, 2018 Census (14-18 ACS) |
|---|---|---|---|
|
Vulnerable, not Gentrifying |
Yes 2018 |
No |
Below MSA median housing value in the tract, change in housing values moderate or low 2000-2018 |
|
Susceptible |
Yes 2018 |
No |
Adjacent -high 2018 home values and/or high home value change 2000-2018 in an adjacent census tract |
|
Early |
Yes 2018 |
No |
Accelerating -2018 home values moderate or low, home value change 2000-2018 high |
|
Middle |
Yes 2018 |
Yes |
Accelerating – 2018 home values moderate or low, home value change 2000-2018 high |
|
Late |
Yes 2000, No 2018 |
Yes |
Accelerating/Appreciated, 2000 home values moderate or low, 2018 values high and high home value change 2000 -2018 |
Beginning with the vulnerability index for census tracts profiled above, we first looked at patterns of socio-demographic change between 2000 and 2018. We examined four change variables to assess possible displacement risk in vulnerable census tracts:
- Homeownership – increase in the share of households that own rather than rent;
- Educational Attainment – increase in the share of adults 25 or over holding a bachelor’s degree or higher;
- White, Non- Hispanic/Latino Residents – increase in the percent of the population that identifies as White, Non-Hispanic Latino;
- Income –increase in median family income.
Census tracts within the 25 MSAs were considered as experiencing socio-demographic change if at least two of the four variables above had significantly higher change values than the average in the given MSA. The significance of the tract difference was estimated with a Z-score. If the Z-score for at least two of the above variables exceeded +0.5 the tract was designated as experiencing significant demographic change over the 2000-2018 period.
Second, in evaluating displacement risk we examined the change in the median value of owner-occupied housing (or in a few cases median rents) in the census tracts of the principal city of an MSA. To assess housing cost dynamics we used three variables:
- Housing Value 2000 - Median housing value (median gross rent if the housing value is not available) in census tract compared to the median value of the principal city;
- Housing Value 2018 - Median housing value (median gross rent if the housing value is not available) in census tract compared to the median value of the principal city;
- Housing Market Change – There are three types of housing market change:
- Accelerating: if the census tract had low or moderate housing values in 2018, but the change in the median housing value in the tract is at the top two quintiles of the rate of change in the principal city in the MSA, value change is classified as high/accelerating.
- Appreciated: if a tract had low or moderate 2000 housing values and high (top two quintiles) housing values in 2018 and high (top two quintiles appreciation (2000-2018) it was classified as an “appreciated” tract.
- Adjacent: we also analyzed if census tracts with low or moderate values in 2000 and low housing value appreciation rates (2000-2018) shared some border (was adjacent) with a census tract with high 2018 home values (top two quintiles) and/or high home value change 2000-2018.
Putting these three elements together, we developed a classification for all of the census tracts in principle cities in the 25 Texas MSAs that measures displacement (or gentrification) risk. The following table outlines five stages of displacement risk or gentrification pressure.
[i] For the end period (2018) we used data from the five year American Community Survey (ACS) for 2014-2018 from the U.S Census Bureau.
[ii] Way, Heather, Elizabeth Mueller and Jake Wegmann. 2018. Uprooted: Residential Displacement and in Austin’s Gentrifying Neighborhoods and What Can Be Done About It, University of Texas at Austin, Center of Sustainable Development and Entrepreneurship and Community Development Clinic, School of Law. See also Pendall, Rolf et al. 2012. Vulnerable People, Precarious Housing, and Regional Resilience: An Exploratory Analysis, Housing Policy Debate, 22:2, pp.271-296 and Bates, Lisa. 2013. Gentrification and Displacement Study: Implementing an Equitable Inclusive Development Strategy in the Context of Gentrification, May, https://pdxscholar.library.pdx.edu/cgi/viewcontent.cgi?article=1082&context=usp_fac
[iii] For a detailed discussion of changing urban and suburban growth trends in Texas metros see, Lieberknecht et al. 2019, People, Land and Water: Stories of Metropolitan Growth, Austin, Planet Texas 2050 and University of Texas, Bridging Barriers, https://tmo.utexas.edu/sites/default/files/PeopleLandWater.pdf
[iv] See for example Barrington-Leigh, Christopher and Adam Millard –Ball. 2015, “A Century of Sprawl in the United States,” Proceedings of the National Academy of Sciences, 112, pp. 8244-8249 and Hamdi, S., R. Ewing, I. Preuss and A. Dodds. 2015. “Measuring Sprawl and its Impacts: An Update,” Journal of Planning Education and Research, Vol. 35, pp. 35-50, Myers, Dowell. 2015. Peak Millennials: Three Reinforcing Cycles that Amplify the Rise and Fall of Urban Concentration by Millennials,” Housing Policy Debate, Vol. 26, pp. 928-947. Vol. 35, pp. 35-50, Myers, Dowell. 2015. Peak Millennials: Three Reinforcing Cycles that Amplify the Rise and Fall of Urban Concentration by Millennials,” Housing Policy Debate, Vol. 26, pp. 928-947.
[v] See Ehrenhalt, Alan. 2013. The Great Inversion and the Future of the American City, New York: Vintage Press.